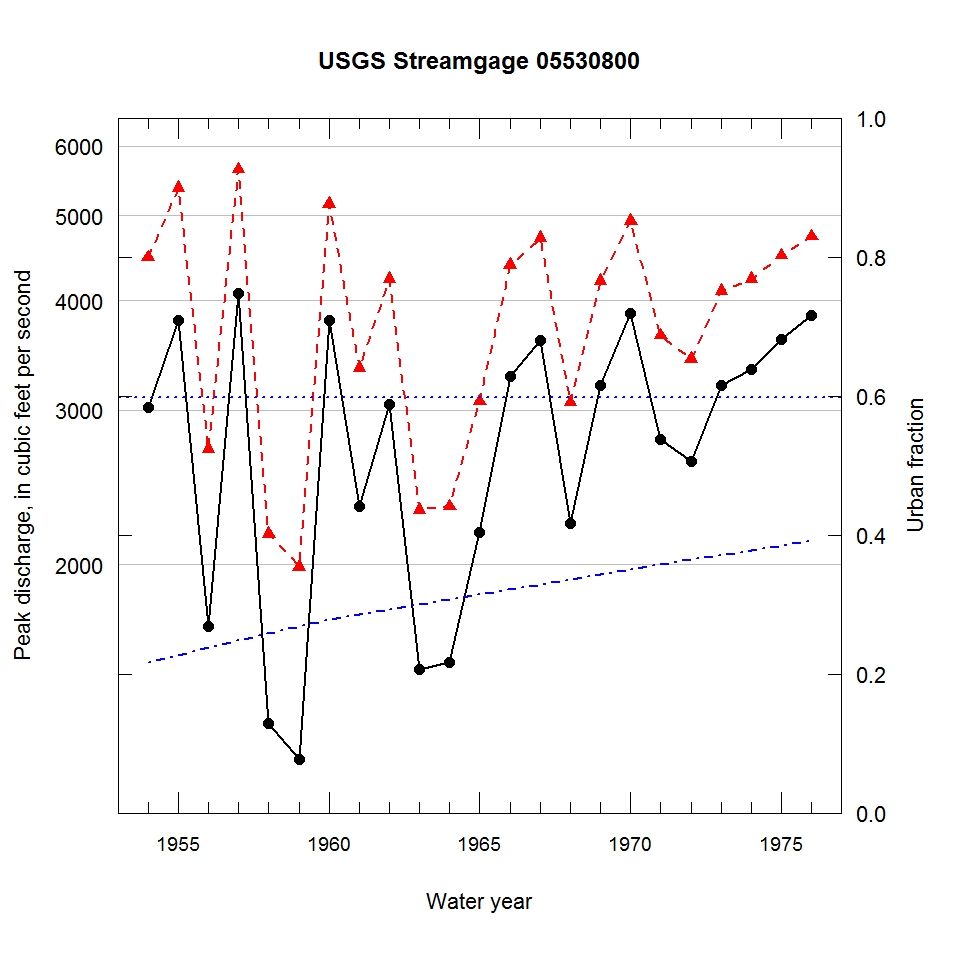
Observed and urbanization-adjusted annual maximum peak discharge and associated urban fraction and precipitation values at USGS streamgage:
05530800 DES PLAINES RIVER AT FOREST PARK, IL


| Water year | Segment | Discharge code | Cumulative reservoir storage (acre-feet) | Urban fraction | Precipitation (inches) | Observed peak discharge (ft3/s) | Adjusted peak discharge (ft3/s) | Exceedance probability |
| 1954 | 1 | -- | 6283 | 0.217 | 1.429 | 3020 | 4480 | 0.345 |
| 1955 | 1 | -- | 6283 | 0.227 | 2.709 | 3800 | 5370 | 0.201 |
| 1956 | 1 | -- | 6283 | 0.238 | 1.250 | 1700 | 2710 | 0.754 |
| 1957 | 1 | -- | 6653 | 0.248 | 1.613 | 4080 | 5640 | 0.179 |
| 1958 | 1 | -- | 6653 | 0.258 | 0.185 | 1320 | 2170 | 0.863 |
| 1959 | 1 | -- | 6653 | 0.268 | 1.191 | 1200 | 1990 | 0.894 |
| 1960 | 1 | -- | 6822 | 0.278 | 0.535 | 3800 | 5150 | 0.231 |
| 1961 | 1 | -- | 6822 | 0.286 | 1.332 | 2330 | 3350 | 0.601 |
| 1962 | 1 | -- | 7316 | 0.293 | 0.249 | 3050 | 4230 | 0.395 |
| 1963 | 1 | -- | 7316 | 0.300 | 1.308 | 1520 | 2310 | 0.835 |
| 1964 | 1 | -- | 7533 | 0.307 | 0.759 | 1550 | 2330 | 0.832 |
| 1965 | 1 | -- | 7533 | 0.315 | 0.512 | 2180 | 3070 | 0.666 |
| 1966 | 1 | -- | 7533 | 0.322 | 1.183 | 3280 | 4390 | 0.364 |
| 1967 | 1 | -- | 7533 | 0.329 | 1.497 | 3600 | 4710 | 0.300 |
| 1968 | 1 | -- | 7533 | 0.336 | 0.997 | 2230 | 3060 | 0.668 |
| 1969 | 1 | -- | 7573 | 0.343 | 1.353 | 3200 | 4210 | 0.400 |
| 1970 | 1 | -- | 7573 | 0.351 | 1.523 | 3870 | 4930 | 0.264 |
| 1971 | 1 | -- | 7573 | 0.357 | 0.087 | 2780 | 3650 | 0.524 |
| 1972 | 1 | -- | 8473 | 0.364 | 1.089 | 2620 | 3430 | 0.579 |
| 1973 | 1 | -- | 8573 | 0.371 | 1.371 | 3200 | 4100 | 0.424 |
| 1974 | 1 | -- | 8573 | 0.378 | 0.599 | 3340 | 4230 | 0.396 |
| 1975 | 1 | -- | 8573 | 0.385 | 0.784 | 3610 | 4500 | 0.341 |
| 1976 | 1 | -- | 8573 | 0.392 | 1.173 | 3850 | 4730 | 0.296 |

